
💡 Between July 2021 and April 2023, East Antarctica accumulated a record 695 billion tons of ice - the largest 22-month gain ever measured by satellite. A study in Nature traced the cause to unusual warmth in tropical oceans thousands of kilometres away. The ice sheet is still losing mass long-term; this was a temporary regional pulse.
- East Antarctica gained 695 billion tons between July 2021 and April 2023 - the largest 22-month accumulation in the satellite era, roughly equivalent to five years of the continent's average annual net ice loss.
- A Nature study traced the mechanism to the tropical warm pool (western Pacific/eastern Indian Ocean): sustained sea-surface warming generated Rossby wave trains that redirected atmospheric rivers toward East Antarctica, producing exceptional snowfall.
- Human-caused warming contributed roughly 9% of the anomalous snowfall; the dominant driver was natural variability in tropical sea surface temperatures.
- West Antarctica kept losing ice throughout, and the continent's long-term net loss rate of about 140.5 billion tons per year is unchanged.
- Honest caveat: this event was temporary, comparable events occur roughly once per decade, and the gain does not reverse decades of accumulated ice loss from the continent as a whole.
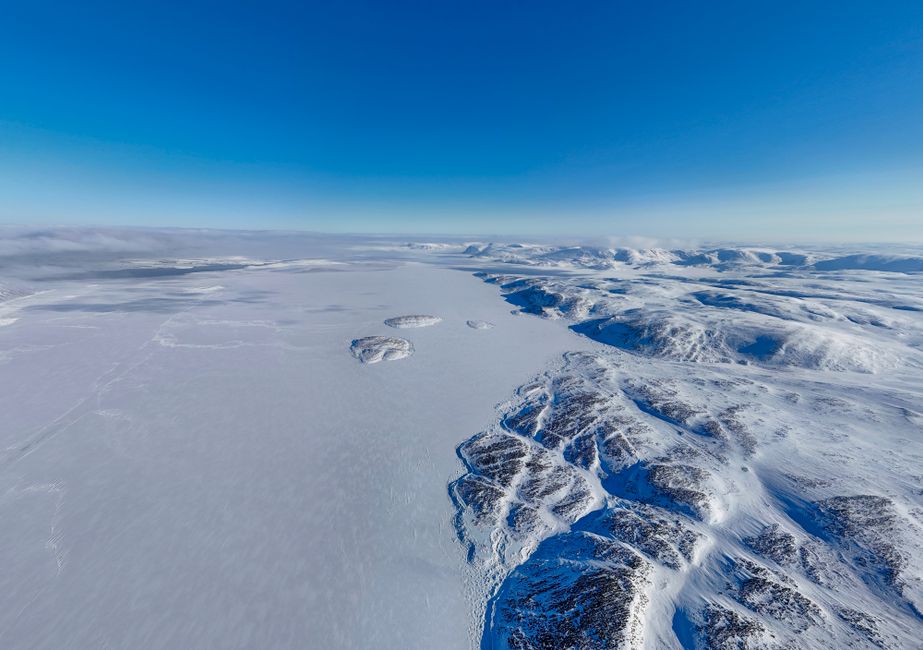
What happened to the Antarctic ice sheet in 2021-2023?
Between July 2021 and April 2023, GRACE-FO satellites recorded something unusual: the Antarctic ice sheet gained approximately 695 billion tons of mass across East Antarctica. That figure is not an error. It is the single largest 22-month accumulation ever measured in the satellite gravity record, which stretches back to 2002.
To calibrate the size of that number: Antarctica has been losing ice at an average of roughly 140.5 billion tons per year over the past two decades. The 2021-2023 event added back roughly five years of average annual losses - at least in East Antarctica, and only temporarily.
A study led by Yunhe Wang of the Institute of Oceanology, Chinese Academy of Sciences, published in Nature on August 19, 2026, traced the mechanism. The central finding: the trigger was not local cooling or a shift in Antarctic weather patterns, but a sustained patch of unusually warm ocean in the tropics, thousands of kilometres away.
How warm tropical oceans sent snow to Antarctica
The tropical warm pool sits where the western Pacific Ocean meets the eastern Indian Ocean. When sea surface temperatures there stay elevated for an extended period, extra heat and moisture enter the atmosphere above. That energy drives a large-scale atmospheric response.
The researchers found that sustained warming in the tropical warm pool generated a Rossby wave train: a slow-moving pattern of atmospheric pressure ridges and troughs that can propagate thousands of kilometres from the tropics toward the poles. When this wave train reached the region of East Antarctica, it established a north-south pressure dipole - high pressure to the north, low pressure over the continent.
That pressure pattern acted as an atmospheric funnel. It redirected moisture-laden atmospheric rivers - concentrated corridors of water vapour in the upper atmosphere - directly over Queen Mary Land and Wilkes Land on the East Antarctic coast. The moisture fell as heavy snowfall over weeks and months, accumulating into the record 695 billion ton gain. The researchers describe this as a "tropical warm pool - East Antarctic Ice Sheet teleconnection": a causal atmospheric link between two distant parts of the climate system.
Why does a warmer tropical ocean produce more snowfall thousands of kilometres away?
The mechanism is indirect. The tropical ocean did not cool East Antarctica; it altered the atmospheric circulation above it. A warmer tropical sea surface means more evaporation and more moisture circulating in the atmosphere. When Rossby wave dynamics channeled that moisture poleward, it arrived at Antarctica where conditions converted it to snow.
Think of the atmosphere as a pipe network. The Rossby wave pattern temporarily aimed a large pipe from the tropics toward East Antarctica, delivering moisture that would otherwise have been distributed elsewhere. The driving pressure came from tropical heat; the outlet was over the Antarctic plateau.
Human-caused climate change contributed to this event, but modestly. The researchers estimated that anthropogenic warming accounted for about 9% of the anomalous snowfall. The remaining 91% came from natural variability in tropical sea surface temperatures. As the tropical ocean baseline warms over coming decades, future events of this type may carry a stronger anthropogenic fingerprint.
What does this mean for how you read climate news?
When a headline reports "Antarctica gained ice," many readers assume it contradicts the story of climate change. This event illustrates why that reading is wrong - and why understanding the difference matters.
Four things to keep in mind when you see this kind of headline:
- Temporary vs. trend. The 695 Gt gain was a 22-month event described as temporary by the researchers. The long-term trend, measured across two decades of satellite data, shows net loss of about 140.5 billion tons per year. One anomalous period does not alter the trend.
- Regional, not continental. The gain occurred almost entirely in East Antarctica. West Antarctica, which is more vulnerable to ocean-driven melting, continued losing ice at its usual pace throughout 2021-2023.
- Ice sheet vs. sea ice. The ice sheet sits on land; when it gains mass, it temporarily slows sea-level rise. Floating sea ice does not affect sea level when it melts. This study is about the land-based ice sheet.
- Warm tropics as driver. The cause was warm tropical oceans - part of the same global ocean system that climate change is warming. The event does not signal a recovery; it shows how a warming planet can produce counterintuitive regional effects.
The practical takeaway for anyone following climate science: a single large number in a single region over a short period rarely tells the whole story. Context - trend, region, timeframe, mechanism - is everything.
The honest limits: what this study does not claim
The researchers were careful. The 695 Gt gain does not mean the Antarctic ice sheet is recovering. It means that during those 22 months, more snow fell than ice was lost in East Antarctica. The underlying processes driving long-term loss - ocean warming around the West Antarctic Ice Sheet and ice dynamics - continued unchanged.
The 9% anthropogenic attribution figure comes from comparing climate model runs with and without human-caused forcing. Event attribution science carries uncertainties, and the exact percentage depends on the models used. The researchers present 9% as a central estimate, not a precise measurement.
The study uses GRACE-FO satellite gravity measurements and atmospheric reanalysis data. Reanalysis models carry structural uncertainties, particularly over high-altitude ice sheets where in-situ observations are sparse.
The estimate that comparable tropical warm pool events occur "once per decade" is based on historical records and climate model analysis, not a fixed physical law. The frequency may shift as the climate system changes.
What should you watch for next?
The most important follow-up is whether the next comparable tropical warm pool event produces a similar East Antarctic response, confirming the teleconnection the researchers describe. If future events show a stronger anthropogenic signature, that indicates the baseline shift is amplifying these pulses over time.
Scientists are also watching how East Antarctic gains and West Antarctic losses add up in the net sea-level contribution. The 2021-2023 event temporarily slowed East Antarctica's contribution to sea-level rise - though global sea-level trends are driven by many factors beyond Antarctic ice alone.
This study connects to another recently identified gap in polar climate science: the Arctic cloud factory that current climate models are still missing - a reminder that atmospheric mechanisms at both poles interact with tropical climate systems in ways science is still mapping. The Antarctic ice sheet and the Arctic atmosphere are not isolated; they respond to the same global ocean and atmospheric dynamics.
FAQ
Does this mean Antarctica is recovering from climate change?
No. The 695 billion ton gain was a temporary, regional event caused by unusual tropical ocean temperatures - not a reversal of long-term ice loss. The Antarctic ice sheet has still lost mass on average every year for the past two decades, and West Antarctica continued losing ice even during this period.
What are Rossby waves and why did they matter here?
Rossby waves are slow atmospheric pressure waves generated by temperature contrasts, especially in the tropics. They travel thousands of kilometres from their origin and carry weather patterns to distant regions. In this case, a Rossby wave train from tropical ocean warming redirected moisture toward East Antarctica and produced exceptional snowfall - the core mechanism behind the 695 Gt gain.
How much is 695 billion tons of ice?
It is roughly 695 cubic kilometres of water - equivalent to about five years of Antarctica's average annual net ice loss. Spread evenly over France, it would form a layer about 1.3 metres deep. In a single cube, it would be roughly 8.9 kilometres on each side.
Will this kind of event happen again?
Researchers estimate that comparable tropical warm pool events occur roughly once per decade based on historical records. Whether each such event produces a large Antarctic snowfall pulse depends on the atmospheric Rossby wave response. As the tropical ocean warms further, future events may be stronger or more frequent.
What is the difference between the Antarctic ice sheet and Antarctic sea ice?
The ice sheet is land-based and holds most of Antarctica's ice. Gains and losses in the ice sheet affect global sea levels. Sea ice is frozen ocean water that forms and melts seasonally; when it melts, it does not raise sea levels because it was already floating. This study is about the land-based ice sheet, which is what matters for sea-level projections.
Source(s): Wang et al., Nature, 2026; ScienceDaily coverage (2026)
About the author
Dao Huy (Lucas) is a professional translator working across English, Vietnamese, Chinese and French, with over seven years of experience in technical, scientific and legal documents. He follows frontier research out of genuine curiosity, particularly where language, communication and the way humans understand complex systems intersect. When a scientific finding changes how to read a headline, he finds it worth writing about.
If your work involves translating scientific, technical or environmental reports into Vietnamese or between any of the four languages he works in, Lucas offers accurate, context-aware translation and localization. Request a quote at daohuy.com.

Bài viết bởi Đào Huy (Lucas), biên dịch viên và chuyên viên bản địa hóa tiếng Việt (Anh, Trung, Pháp sang Việt). See translation services →